In this introduction to Base SAS Base we will begin to explore the world of SAS, starting with the fundamental building block: the programming language.
This is the first lesson of the Base SAS course, to be followed by others, focused on the different aspects of the language for data analysis and exploration.
Intro to Base SAS
SAS, an acronym that stands for Statistical Analysis System, is one of the most used software tools to conduct analyses on data. The company, based in Cary (North Carolina), produces a large variety of software tools, but each of these is based on its own proprietary engine: Base SAS.
This is a real programming language. Through SAS Base it is in fact possible to make any statistical analysis automatic, and therefore re-executable.
The language is divided into two logical steps:
- Data Step — This allows you to perform ETL and data manipulation operations. These include data extraction, transformation and loading operations;
- Proc Step — Encapsulates all SAS procedures (proc stands indeed for procedure). Among the most used procedures there are for example the PROC PRINT, which allows you to display the first n records of a dataset on the screen; or the PROC SQL, which allows you to execute SQL code within the SAS environment, and so on.
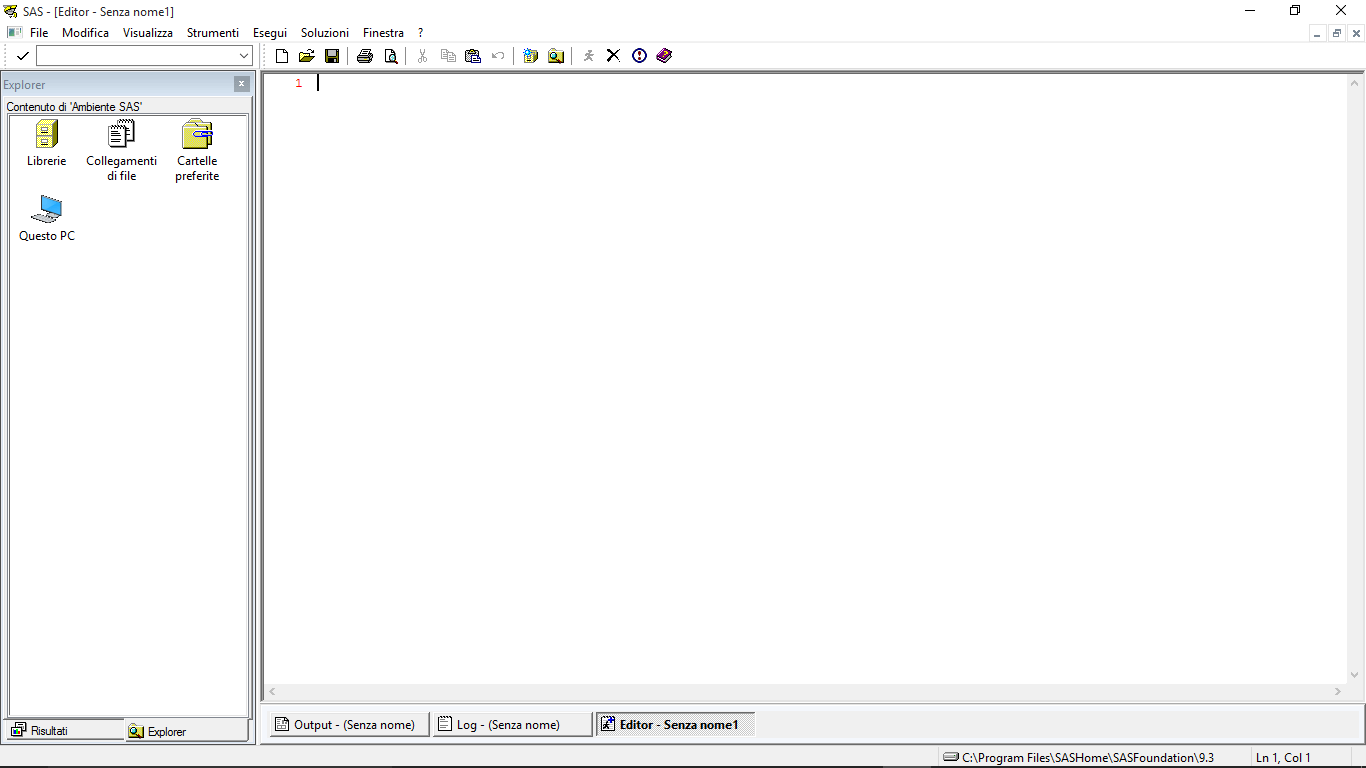
Interface
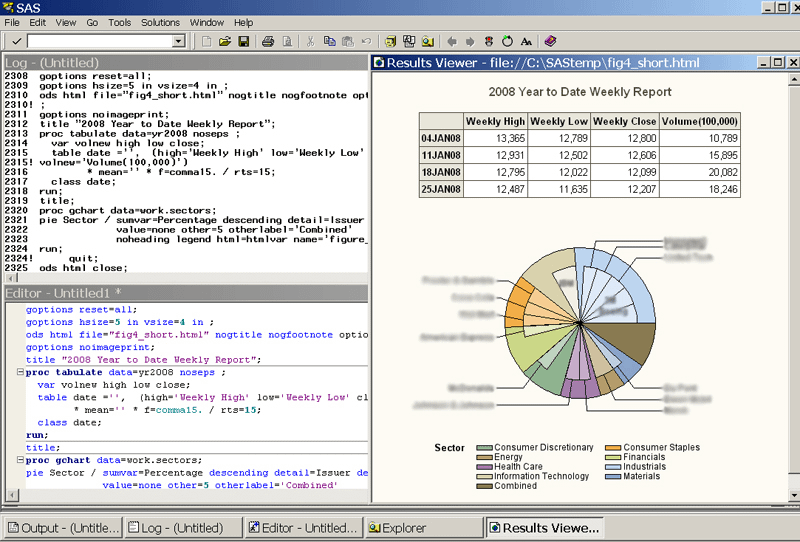
The graphical interface of SAS Base is minimal and clean. It has two main panels, the first one on the left, necessary to explore the resources coming from SAS libraries or from the file system. In the second one, the one that occupies most of the screen, three tabs are available:
- Output — This panel shows the reports, whether graphical or tabular, of the procedures performed.
- Log — Allows you to verify the correct execution of the launched procedures
- Editor — This is an intelligent text editor, equipped with some handy features like syntax highlighting. Here you can enter SAS code that you can then execute.
An example
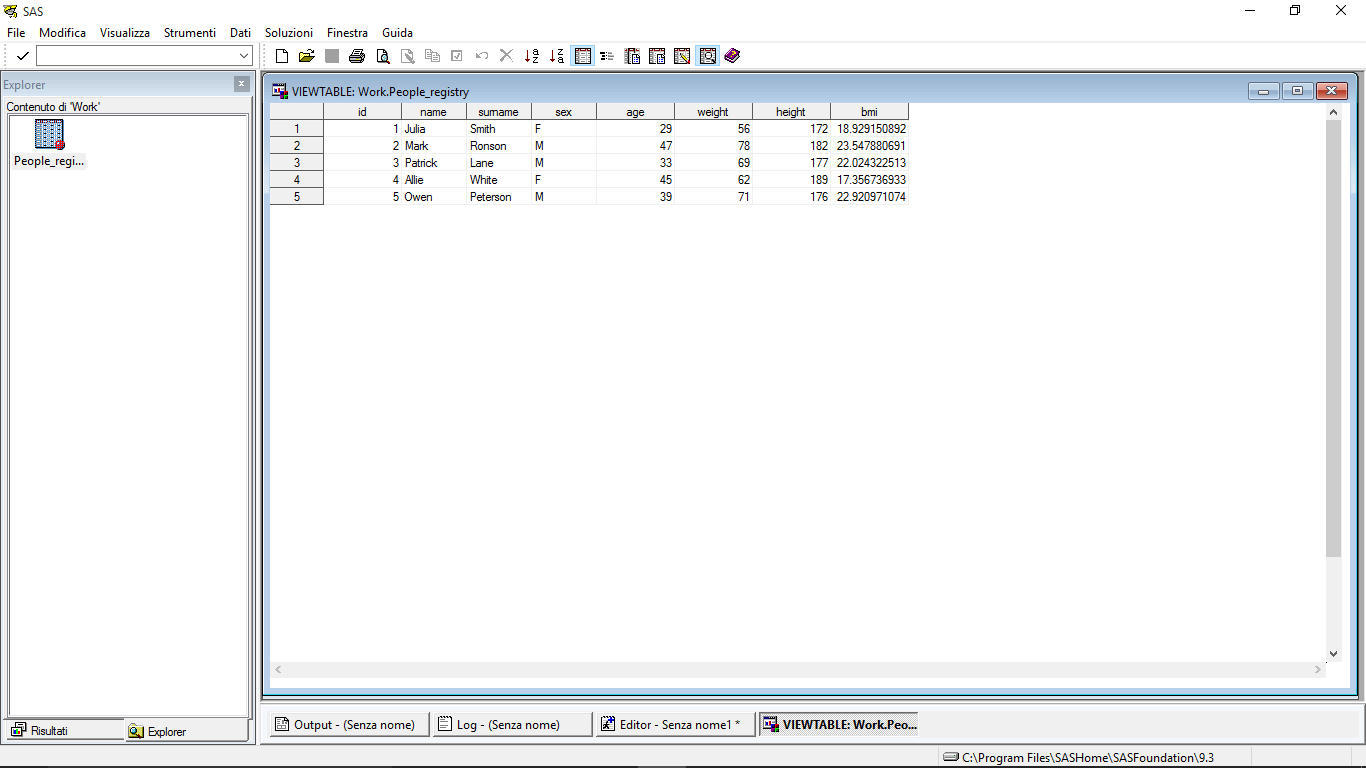
Now let’s start putting our hands on the code, developing a small example that will be useful for exploring the first features of the data step. In fact, the following code snippet allows you to load a dataset by inserting the data one record after another with the datalines instruction. The example in question examines a personal dataset of 5 subjects, reporting their name, surname, gender, age, height expressed in centimeters and weight expressed in kilograms.
Let’s paste and then execute the following SAS code inside the editor:
data people_registry;
	input id name $ surname $ sex $ age weight height;
	datalines;
1 Julia Smith F 29 56 172
2 Mark Ronson M 47 78 182
3 Patrick Lane M 33 69 177
4 Allie White F 45 62 189
5 Owen Peterson M 39 71 176
;
run;
Once the code has been executed, the SAS People_registry dataset is available and can be viewed by clicking on the left panel at the path Libraries > Work. Here we will find our SAS table loaded and visible as shown below.
Now let’s also practice creating calculated variables within a data step. We therefore calculate the Body Mass Index (Body Mass Index) of each subject, which is expressed as

So the following SAS code extract takes the people_registry dataset as input and creates a new calculated variable bmi, which calculates the value expressed by the previous formula.
data people_registry;
	set people_registry;
	bmi = weight / ( ( height / 100 ) ** 2 );
run;
Base SAS Course Index
To make it easier for you to read the Base SAS course, the index including all the topics covered is shown at the end of each article.
- Introduction to Base SAS
- The conditional instruction in Base SAS
Download
- The pdf version of this article: Introduction to Base SAS PDF
- The SAS file used in this post people_registry


